Sunday, April 6, 2014

ENHANCEMENTS to SSD for R - version 1.4.3

We simply don't rest!  In the past few weeks we have been hard at work getting the book ready for publication AND we have added some enhancements to SSD for R!

First, to get the newest version of our software, simply click the "Check for Updates" button in the Packages pane of RStudio. You may want to update all your packages, but you will DEFINITELY want to update SSD for R.  Here's what's new:

Trimline() - this function enables you to add a trimmed mean line to an ABplot().  We had this function before, but now when you run the function, the value for the trimmed mean is displayed in the Console.  How does this help you?  It makes labeling your graph really, really easy.  For example, it took me about 30 seconds to produce and completely annotate this graph of a client's crying behavior.


IQRline() - this function enables you to add interquartile range lines to any phase on an ABplot().  Again, we had this function before, but output in the Console makes it really easy to label your graphs quickly.  Here's what this could look like with the same client's crying behavior.


ABstat() - again, the output in the Console makes labeling graphs a snap.  In this case, we added and labeled the median line to the ABplot() above.  Now, we essentially have the middle part of a box plot superimposed on a line graph!


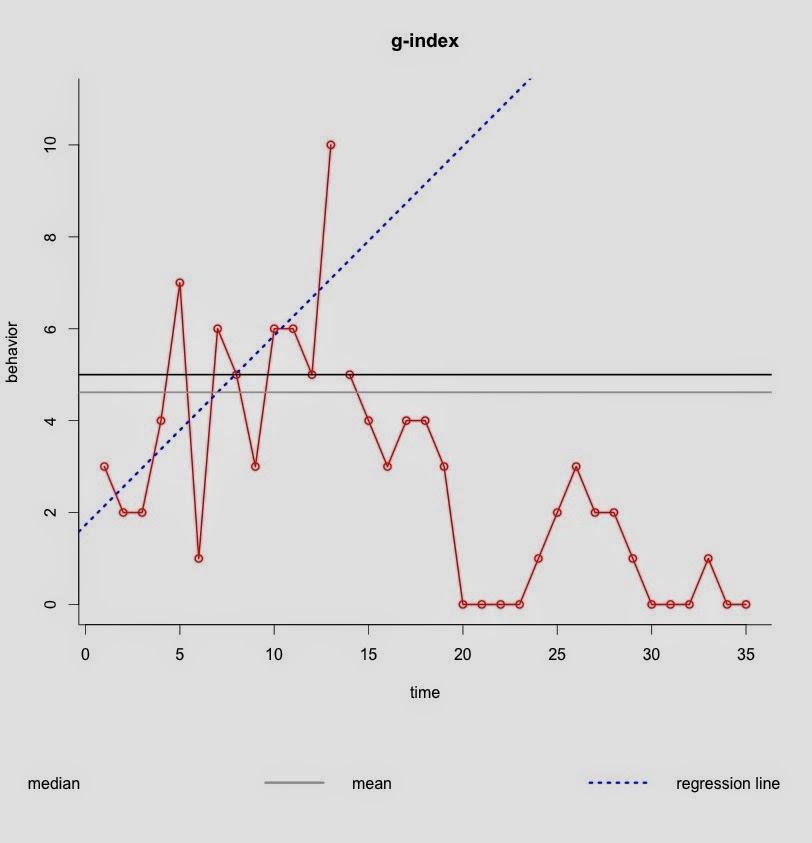
Gindex() - finally, we added some additional information in the output to this effect size function.  Now, we can interpret our findings more easily.


With accepted values displayed in the output, we can see that our desired range, below the regression line, has a calculated value of 0.462, which is indicative of a medium effect.  The graph in the plots pane helps us visualize this clearly.


Be sure to check out these and other enhancements on our website:  ssdanalysis.com

And, as always, be sure to email us you comments or ideas:  cwresearchassociates@gmail.com


Saturday, March 15, 2014

PREORDER!!!!

We haven't written about our book lately because, frankly, it is not out yet and so there is little to say.  We have, however, been busy working with Oxford to get SSD for R:  An R Package for Analyzing Single-Subject Data ready for market.

We have worked with the copy editors, who have been wonderful, to make sure both the text and the art work look good.  We have SO many graphs in the book that this took a while.  We had debated putting so many in, but we really wanted readers to be able to step through each of the functions while they are analyzing sample data.  The best way to do this, we thought, would be to provide visuals so people could confirm that they are getting and interpreting their output correctly.

Then, we got the galleys.  For those that aren't familiar with publishing, this is an electronic version of what the final product should look like.  We were blown away!  The text is laid out really nicely and the publishers integrated the graphics with the text well.  It looks gorgeous, if we do say so ourselves.

So....

Get out there and pre-order the book! You can find it here on Amazon and here on Barnes and Noble.  We worked hard with Oxford to keep the cost of this book down, and you'll see that they obliged us.  We wanted people to be able to purchase our book with out breaking the bank.  When you check out the links, you will notice that, for now, the cover is not shown, but trust us - it looks snazzy!

Sunday, March 2, 2014

SSD for R in the classroom: Student projects

We are about a third of the way through the Spring semester here in balmy NYC, yet spring seems nowhere to be found!

We have, however, found that our students' projects for the semester are shaping up to be quite interesting.  We thought we'd give you a sample of what they are planning on working on so you can get a sense as to what sorts of single-subject evaluations are going on in our Master's-level classes:

  • One student is doing her placement in a partial hospitalization program that provides services for individuals with eating disorders.  She is going to be examining a clients' compliance with following her meal plan.
  • Another student is going to be working with a young adult client to adapt to life after removal of a significant portion of her intestine due to ulcerative colitis.  This includes getting used to an ostomy bag.
  • Another student, who works with special needs elementary school students, will be using SSD for R to track a client's impulsive behaviors.
  • Finally, another student, who provides marital counseling, will use SSD for R to track both positive and negative interactions in a couple at-risk for divorce. 
We could go on and on, but we will all have to wait and see what our students come up with as the semester unfolds.  We will be sure to share some of our students' work with you later in the semester, with their permission, of course!

In the meantime, feel free to check out our website at www.ssdanalysis.com, and feel free to e-mail us with any comments or questions.

Wednesday, February 19, 2014

Using SSD for R in the Classroom: Learning from our students

Over the past year or so, we have met almost all of you at one time or another in person so you probably know that we like to collaborate - with each other, with those interested in single-subject research, with those doing evaluations, and with our students.

During a class last week, one of Charlie's Master's students, Ezra Fromowitz, came up with a great little suggestion for SSD for R.  When you annotate a simple line graph using the ABstat function, which produces mean, median, and standard deviation lines, why not provide the value for the requested statistic in the Console?  This would make it much easier to further annotate the graph with useful information using the ABtext function.

Here's what Ezra meant:

Let's say we had created the line graph below depicting Jenny's crying episodes during class.  We created the line graph using the ABplot function, added the phase line using the ABlines function, and then labeled the phases using the ABtext function.


Perhaps, however, we would want to add a mean line for the phases.  We could add this by using the ABstat function.  The output in the Console now tells us that the mean for the baseline is 4.615 and the mean for the intervention is 1.591.  We can further annotate our graph to provide some really helpful output:


What an excellent suggestion, Ezra!  

Ezra's suggestion was so helpful that we have now added it to the SSD for R package, so be sure to install the latest version by selecting "Check for Updates" in the Packages pane of RStudio!

If you have any suggestions for making SSD for R better or more useful for you, feel free to email us. And, as always, check out our website because we are updating it frequently these days!


Monday, February 10, 2014

Getting ready for the book!

We are getting ready for the release of SSD for R:  An R Package for Analyzing Single-Subject Research.  We are really excited because we've had some fabulous conversations with folks at all the conferences we've been to this year, and we think this book will be really helpful in advancing single-subject research.

In any event, we have updated our website to make it more useful for book purchasers. In the book (and many of our students have read our manuscript) we have lots of examples using sample data, so we have added a tab to our website called "Datasets." 

Feel free to download the files when you get your book so you can step through each of the examples.

Also, if there is something you would like to see on our website, let us know by emailing us.

Charlie and Wendy

Friday, January 31, 2014

Spring is in the air!

Not actual spring, mind you, since the temperature in New York has barely broken 20 degrees all winter, but the Spring 2014 semester!  We came back from SSWR in San Antonio energized - we had a really good interactive workshop AND we got to meet some other social workers who use R!

In the meantime, we have four sections of Practice Research going on at Wurzweiler this spring, and we thought we would let you know how our students are using SSD for R throughout the semester. 

Everyone teaches a little differently, but, over the years, we have both come to the conclusion that the best way to get students comfortable with using statistical software is to have them use it early, incrementally, and often.  The students don't get into analyzing their own data until later in the semester, so we start out with datasets that we use throughout our book and in our own research.

Charlie's class, which meets in person, has already created their first annotated graph of Jenny's yelling:


Pretty good for the first day of class, huh?

Wendy's class is a distance learning class (a big shout out to Moodle, which is making our lives infinitely easier this semester), so that section is more concerned right now with downloading R, RStudio, and SSD for R, since these students' computer labs are in their living rooms.  Once we have everyone on-board with that, we will be zipping right along.

We have both provided our students with an earlier draft of the manuscript for our book, so they can step through activities at home AND they will be able to refer back to the text throughout the semester when the students eventually analyze their own data.

Stay tuned - we both LOVE teaching this class (and our students enjoy taking it), so we will be blogging often about our students' progress.

In the meantime, feel free to check out our website and feel free to email us!


Wednesday, January 1, 2014

Goal!

Did we get your attention?  No, we are not talking football!  We are talking about the Gline() function, which is in the newest release of SSD for R, 1.4.1.  

After spending some time with John Orme and Terri Combs-Orme at CSWE in Dallas this past November, we thought that it would be a good idea to add a goal line to our graphing functions.  What does a goal line represent?  It displays a personal goal that you're aiming for in your work with your client/student/patient.

Here's an example for you:

Bobby is a child who is throwing temper tantrums at school.  The ultimate goal would be, of course, to eliminate these completely, but a shorter term objective is to decrease the tantrums to no more than one a day.  We can now visualize this:


By adding a goal line, we can see that in the baseline, Bobby met this goal three times, but met it or exceeded it fourteen times in the intervention.

If you haven't downloaded the newest version of SSD for R, do it now so you can use this slick new function!

If you haven't visited our website lately, come see us as www.ssdanalysis.com!