We wanted to let you know that the latest and greatest version of SSD for R is now available for download from CRAN: Version 1.4.5
What's different about this version? We fixed a BUG in the d-index.
This actually means, not only a correction to the Effectsize() function, but also a correction to an error in SSD for R: An R Package for Analyzing Single-System Data.
On page 56, we display the effect size for Jenny's yelling. With a slightly incorrect formula, we OVERESTIMATED the value for the d-index. We initially reported a value of 2.011, but you will see below, with the correction, the actual value is 1.947.
The actual percentage change was very small, but we like precision!
And speaking of effect sizes, we will give you something to look forward - we will be adding Hedge's g to the next version of SSD for R, which will be up on CRAN at the end of July.
Finally, check out the home page of our website at: www.ssdanalysis.com. We are showing off the new cover of our book and provide you with links to where you can purchase it!
As always, feel free to contact us on our website: https://www.ssdanalysis.com/Contact_Page.html
We like hearing from all of you!
Wednesday, June 25, 2014
Wednesday, June 11, 2014
Another student project - Evaluating services with a high school student
In this blog post, we will also feature the work of a
student from our Spring 2014 semester.
This project was completed by Shuli Tsadok.
Shuli did
her internship in a private high school, and she was working with Linda, a 10th
grade student who was new to the school.
Linda was referred for social work services because she was extremely
withdrawn both with peers and with teachers; she rarely interacted with other
students and did not participate in class discussions.
To measure
the problem, Shuli asked Linda’s teacher to record how many times Linda raised
her hand in her English class. The
baseline period was two school weeks (n=10).
During that time, Linda raised her hand, on average, 0.5 times per class
period (SD=0.707).
During this
assessment period, Shuli hypothesized that Linda’s withdrawn behavior was a
result of social anxiety caused by extreme shyness. To intervene with Linda, Shuli chose exposure
therapy in which Linda would be put in positions to interact with others
more. Linda was assigned to a group
project with other students in which she would not only have to collaborate
with her classmates in a somewhat unstructured manner, but she would also have
to give a presentation to the class.
Additionally, Shuli would meet with Linda in public places and
encouraged her to interact with others in these settings. Finally, Linda was given a peer tutor, which
encouraged interaction with at least one other student.
After the
intervention was introduced, the mean number of times Linda raised her hand in
class increased to 1 (SD=0.667).
A line
graph comparing phases is displayed below:
To compare the phases, Shuli noted that there was no issue
of trending or autocorrelation, so she used a t-test as a statistical
method. With a calculated p-value of 0.1211, Shuli noted that
there were no statistical differences between the phases. However, with few data points and the
intervention moving in the right direction, Shuli looked at the effect of the
intervention. The effect size for this
intervention indicated a small degree of change.
The overall
question for this course was to evaluate how well an intervention was working
for a particular client. Shuli noted
that this intervention was not particularly effective for this client. When she thought about it, she concluded that
the lack of meaningful positive change could have been attributed to an
unavoidable interruption in social work services combined with the fact that Linda
is extremely shy. Perhaps an extremely
shy teen may have benefited from a different intervention.
What do YOU think of Shuli's project? Feel free to contact us here and check out some of the additions to our website!
Monday, May 26, 2014
SSD for R in the Classroom: One of our final projects!
Now that the semester has ended, we thought we might show
you some of our students’ final projects.
This first project was done by Catherine Faro.
The client that Catherine worked with was CW, a 21-year-old
white male. CW was recently released from jail and was in treatment at a local
mental health clinic with a recovery program for those dually diagnosed. Catherine noticed that CW was not
participating in his therapeutic group and sought to increase his participation.
After some research, Catherine chose to use Anger
Management for Substance Abuse and Mental Health Clients: A Cognitive
Behavioral Therapy Manual (Reilly & Shopshire, 2002) to intervene with
this client. It was hoped that this
intervention would help CW verbalize his anger, learn adaptive coping skills,
and connect better to group treatment.
To measure CW’s progress, Catherine assessed his
participation at each group session. A
session was coded as 0 if CW did not participate at all, as 1 if he
participated but in a non-substantive manner, and as 2 if he participated fully
and constructively.
Baseline measures were taken for 11 sessions prior to
beginning the intervention and for 26 sessions after the intervention was
introduced.
Catherine produced the following line graph comparing the
baseline to the intervention:
She also produced descriptive
statistics and a box plot for each phase:
Catherine noted that both the mean and median levels of
participation rose with the intervention.
In further analyzing
her data, Catherine did a trend analysis for both baseline and intervention and
noted no significant trend in either phase.
Additionally, she noted no potential issues with autocorrelation in
either phase.
To
statistically compare the two phases,
Catherine used the binomial test to compare baseline successes with
intervention phase successes in two ways.
First, “success” was defined as ANY type of group participation. Looking at it this way, CW was successful
27.2% of the time during the baseline and 67.8% of the time during the
intervention (p=0.00). To evaluate this
intervention more rigorously, Catherine then defined success as only productive
group participation. Under this more
stringent definition, CW was successful during baseline 18% of the time. During the intervention, he was successful
39.3% of the time (p=0.01).
Catherine
then examined the size of the effect of the intervention using the
d-index. She found that that, with the
intervention, CWs group participation improved 27.25%, a small to moderate
effect.
BUT HOW DOES THIS IMPACT
CATHERINE’S PRACTICE WITH CW?
Catherine
concluded that the CBT techniques employed in the intervention may be having an
impact on his self-reflection in group.
In her own words:
“CW became better able to discuss
situations that made him angry, and examine the cognitive processes behind them
and discuss his anger responses in a group setting. These two components
assisted him in participating in group both in general, and in a self-reflective
manner.”
Catherine said that this analysis
“provides support for continued use of CBT techniques to help CW become more
aware of his anger responses, and modulate them to more appropriate and
constructive ways.”
Wednesday, May 14, 2014
Sneak peek of SSD for R: An R Package for Analyzing Single-Subject Data
We have been super busy in the last few weeks with SSD for R between teaching single-subject research methodology to our students and getting ready for the publication of our book.
Excitingly, our book release is imminent. While Amazon.com lists an estimated ship date of July 2 , the folks at Oxford said that they should have the books in their warehouse by May 28, and they should be ready to ship in the day or two after that.
We are really proud of this work, and we are very pleased with the way the book physically looks. Check out our cover:
You can also get a sneak peak of the manuscript on Amazon at: http://www.amazon.com/SSD-package-Analyzing-Single-Subject-Data/dp/0199343594/ref=sr_1_1?s=books&ie=UTF8&qid=1400077997&sr=1-1&keywords=auerbach+and+zeitlin
Or on Google books at: http://books.google.com/books?id=guB_AwAAQBAJ&pg=PA6&dq=auerbach+and+zeitlin&hl=en&sa=X&ei=VoBzU5zMBKqqsQSZooHIBw&ved=0CC0Q6AEwAA#v=onepage&q&f=false
What do you think? We'd love to hear from you! Feel free to email us here. And check out our website! All the sample files contained in the book are located on the Datasets tab at www.ssdanalysis.com.
Excitingly, our book release is imminent. While Amazon.com lists an estimated ship date of July 2 , the folks at Oxford said that they should have the books in their warehouse by May 28, and they should be ready to ship in the day or two after that.
We are really proud of this work, and we are very pleased with the way the book physically looks. Check out our cover:
You can also get a sneak peak of the manuscript on Amazon at: http://www.amazon.com/SSD-package-Analyzing-Single-Subject-Data/dp/0199343594/ref=sr_1_1?s=books&ie=UTF8&qid=1400077997&sr=1-1&keywords=auerbach+and+zeitlin
Or on Google books at: http://books.google.com/books?id=guB_AwAAQBAJ&pg=PA6&dq=auerbach+and+zeitlin&hl=en&sa=X&ei=VoBzU5zMBKqqsQSZooHIBw&ved=0CC0Q6AEwAA#v=onepage&q&f=false
What do you think? We'd love to hear from you! Feel free to email us here. And check out our website! All the sample files contained in the book are located on the Datasets tab at www.ssdanalysis.com.
Sunday, April 6, 2014
ENHANCEMENTS to SSD for R - version 1.4.3
We simply don't rest! In the past few weeks we have been hard at work getting the book ready for publication AND we have added some enhancements to SSD for R!
First, to get the newest version of our software, simply click the "Check for Updates" button in the Packages pane of RStudio. You may want to update all your packages, but you will DEFINITELY want to update SSD for R. Here's what's new:
Trimline() - this function enables you to add a trimmed mean line to an ABplot(). We had this function before, but now when you run the function, the value for the trimmed mean is displayed in the Console. How does this help you? It makes labeling your graph really, really easy. For example, it took me about 30 seconds to produce and completely annotate this graph of a client's crying behavior.
First, to get the newest version of our software, simply click the "Check for Updates" button in the Packages pane of RStudio. You may want to update all your packages, but you will DEFINITELY want to update SSD for R. Here's what's new:
Trimline() - this function enables you to add a trimmed mean line to an ABplot(). We had this function before, but now when you run the function, the value for the trimmed mean is displayed in the Console. How does this help you? It makes labeling your graph really, really easy. For example, it took me about 30 seconds to produce and completely annotate this graph of a client's crying behavior.
IQRline() - this function enables you to add interquartile range lines to any phase on an ABplot(). Again, we had this function before, but output in the Console makes it really easy to label your graphs quickly. Here's what this could look like with the same client's crying behavior.
ABstat() - again, the output in the Console makes labeling graphs a snap. In this case, we added and labeled the median line to the ABplot() above. Now, we essentially have the middle part of a box plot superimposed on a line graph!
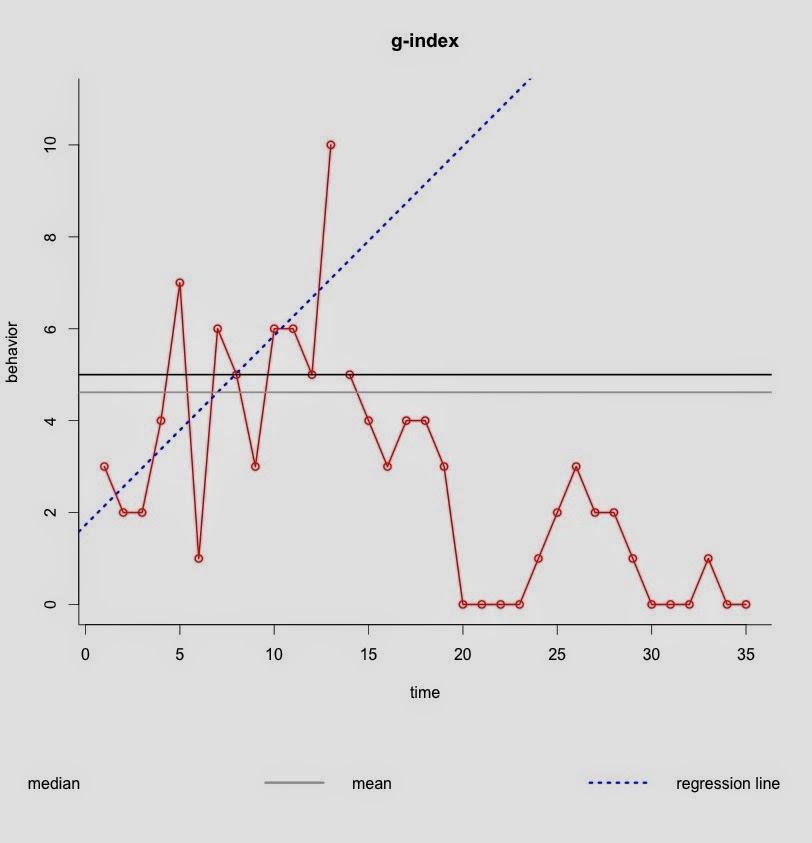
Gindex() - finally, we added some additional information in the output to this effect size function. Now, we can interpret our findings more easily.
With accepted values displayed in the output, we can see that our desired range, below the regression line, has a calculated value of 0.462, which is indicative of a medium effect. The graph in the plots pane helps us visualize this clearly.
Be sure to check out these and other enhancements on our website: ssdanalysis.com
And, as always, be sure to email us you comments or ideas: cwresearchassociates@gmail.com
Saturday, March 15, 2014
PREORDER!!!!
We haven't written about our book lately because, frankly, it is not out yet and so there is little to say. We have, however, been busy working with Oxford to get SSD for R: An R Package for Analyzing Single-Subject Data ready for market.
We have worked with the copy editors, who have been wonderful, to make sure both the text and the art work look good. We have SO many graphs in the book that this took a while. We had debated putting so many in, but we really wanted readers to be able to step through each of the functions while they are analyzing sample data. The best way to do this, we thought, would be to provide visuals so people could confirm that they are getting and interpreting their output correctly.
Then, we got the galleys. For those that aren't familiar with publishing, this is an electronic version of what the final product should look like. We were blown away! The text is laid out really nicely and the publishers integrated the graphics with the text well. It looks gorgeous, if we do say so ourselves.
So....
Get out there and pre-order the book! You can find it here on Amazon and here on Barnes and Noble. We worked hard with Oxford to keep the cost of this book down, and you'll see that they obliged us. We wanted people to be able to purchase our book with out breaking the bank. When you check out the links, you will notice that, for now, the cover is not shown, but trust us - it looks snazzy!
We have worked with the copy editors, who have been wonderful, to make sure both the text and the art work look good. We have SO many graphs in the book that this took a while. We had debated putting so many in, but we really wanted readers to be able to step through each of the functions while they are analyzing sample data. The best way to do this, we thought, would be to provide visuals so people could confirm that they are getting and interpreting their output correctly.
Then, we got the galleys. For those that aren't familiar with publishing, this is an electronic version of what the final product should look like. We were blown away! The text is laid out really nicely and the publishers integrated the graphics with the text well. It looks gorgeous, if we do say so ourselves.
So....
Get out there and pre-order the book! You can find it here on Amazon and here on Barnes and Noble. We worked hard with Oxford to keep the cost of this book down, and you'll see that they obliged us. We wanted people to be able to purchase our book with out breaking the bank. When you check out the links, you will notice that, for now, the cover is not shown, but trust us - it looks snazzy!
Sunday, March 2, 2014
SSD for R in the classroom: Student projects
We are about a third of the way through the Spring semester here in balmy NYC, yet spring seems nowhere to be found!
We have, however, found that our students' projects for the semester are shaping up to be quite interesting. We thought we'd give you a sample of what they are planning on working on so you can get a sense as to what sorts of single-subject evaluations are going on in our Master's-level classes:
- One student is doing her placement in a partial hospitalization program that provides services for individuals with eating disorders. She is going to be examining a clients' compliance with following her meal plan.
- Another student is going to be working with a young adult client to adapt to life after removal of a significant portion of her intestine due to ulcerative colitis. This includes getting used to an ostomy bag.
- Another student, who works with special needs elementary school students, will be using SSD for R to track a client's impulsive behaviors.
- Finally, another student, who provides marital counseling, will use SSD for R to track both positive and negative interactions in a couple at-risk for divorce.
We could go on and on, but we will all have to wait and see what our students come up with as the semester unfolds. We will be sure to share some of our students' work with you later in the semester, with their permission, of course!
In the meantime, feel free to check out our website at www.ssdanalysis.com, and feel free to e-mail us with any comments or questions.
Subscribe to:
Posts (Atom)